How to Use the Grafana VPS Template
Grafana is an open-source analytics and monitoring solution for visualizing and analyzing data from various sources. The Ubuntu 24.04 with Grafana VPS template from Hallo-Webseite.de comes with Grafana preinstalled, allowing you to quickly set up dashboards and monitor system metrics, logs, or external data sources. This guide walks you through the setup and management of Grafana on your VPS.
Explore Hallo-Webseite.desGrafana VPS hosting plansfor more details ?
Accessing the Grafana Web Interface
Grafana runs on a port
3000by default. Open your web browser and navigate to:<code>http://[your-vps-ip]:3000</code>
When accessing Grafana, you must log in using the username admin and the password set during installation.

Configuring Data Sources
To begin using Grafana effectively, you need to connect it to a data source. In the Grafana interface, navigate to theConnectionssection and selectData Sources. From here, you can add a new data source by choosing from supported databases such as Prometheus, MySQL, or PostgreSQL. After entering the necessary connection details, save the configuration and test the connection to ensure it works correctly.
Setting Up Dashboards
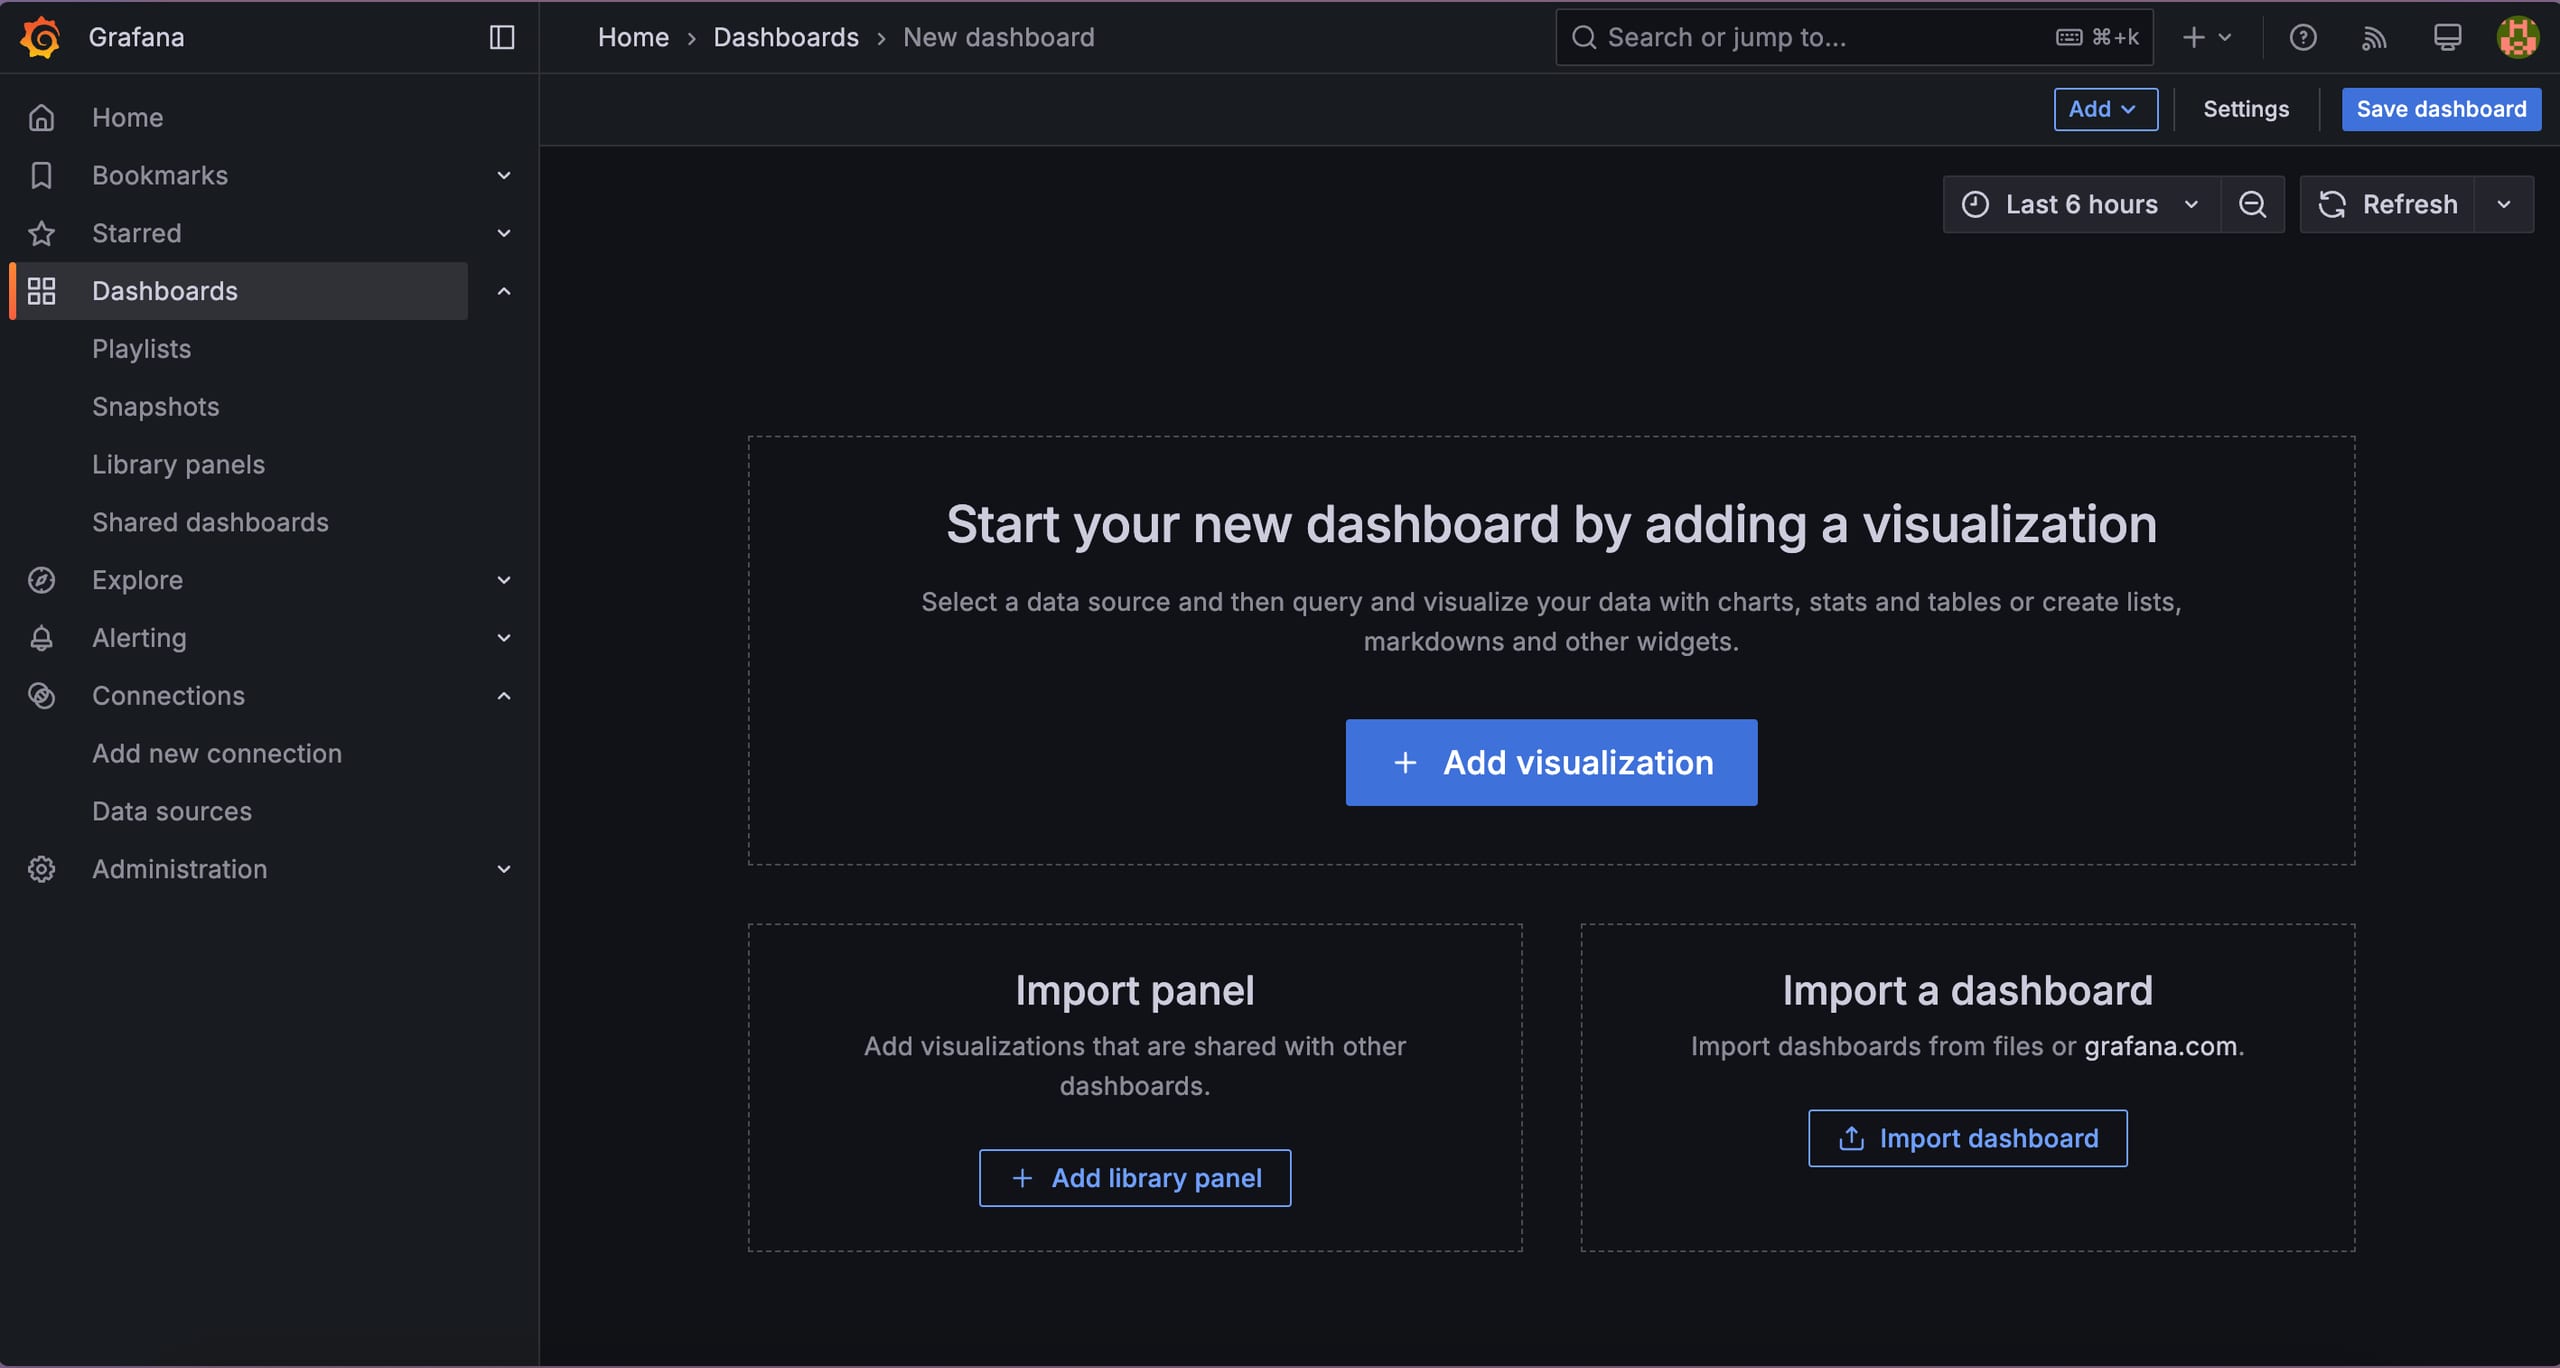
Dashboards in Grafana allow you to visualize and analyze your data organizationally. To create a new dashboard, navigate to theDashboardssection and selectNew Dashboard. Add a new panel where you can configure queries and select a visualization type such as Graph, Table, or Heatmap. Once configured, save the panel and arrange multiple panels to customize your dashboard layout, creating a comprehensive view of your data.

You can easily set up a powerful monitoring and visualization platform with the Ubuntu 24.04 with Grafana VPS template from Hallo-Webseite.de. By following this guide, you can configure, secure, and manage your Grafana instance to track key metrics and gain valuable insights. If youd like more customization, please consult the officialGrafana documentation.
